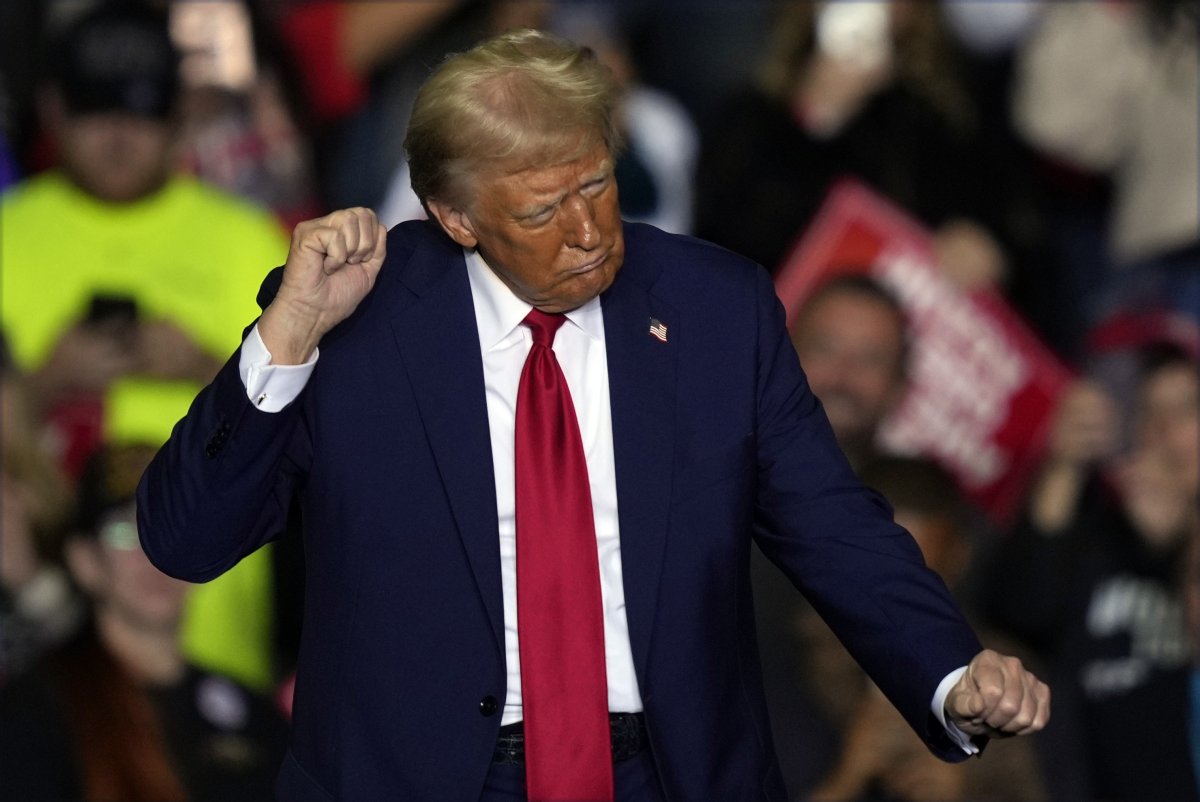
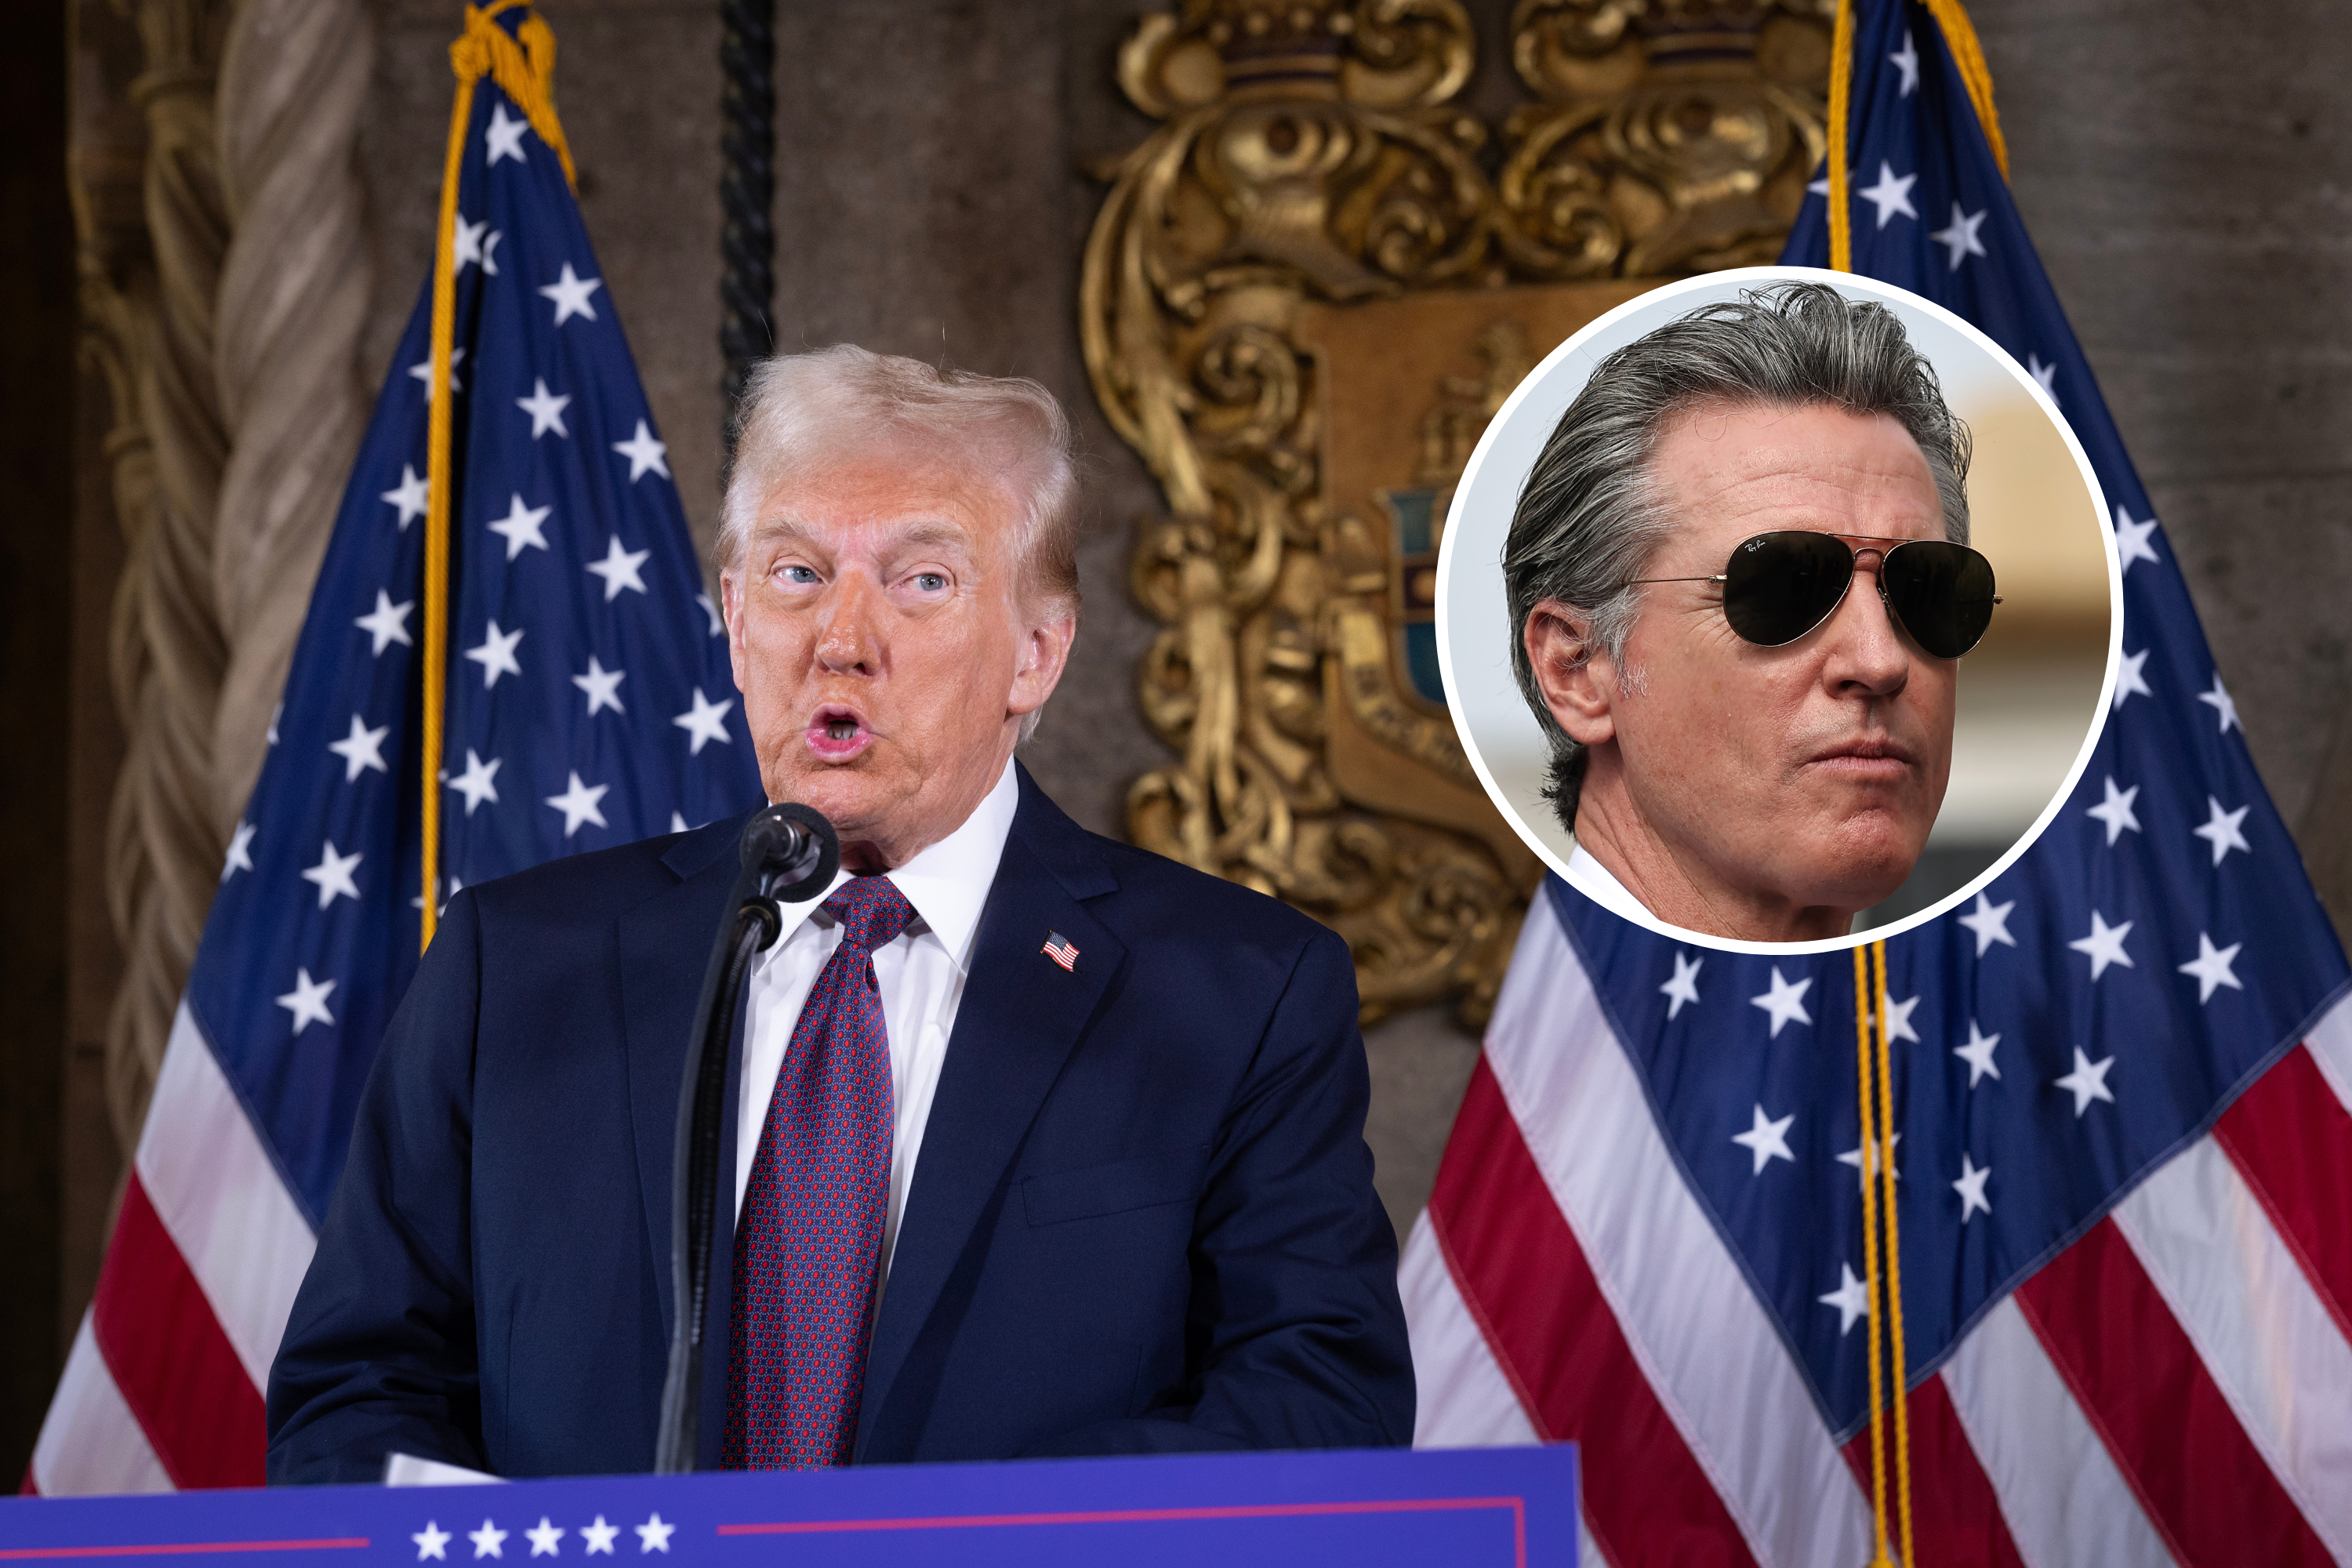
The creator of a market indicator which has correctly predicted 21 out of the last 24 elections says "history will tweak itself" toward a Donald Trump victory this year, despite market conditions pointing to a Kamala Harris victory.
Sam Stovall created one of the stock market's most reliable election indicators, based on how the S&P 500 performs in the final three months before an election. This model has correctly predicted the election winner in every presidential election year since Ronald Reagan won a second term in 1984.
But, while this quarter's S&P 500 looks to be headed toward forecasting a victory for Harris, as the candidate from the incumbent party, Stovall has said he thinks other variables will put Trump in the White House.
Discussing the upcoming results of the most recent earnings season on CNBC Television, Stovall said he "would not be surprised if this ends up being the 60th out of the last 62 quarters in which the actual results exceed end-of-quarter estimates," which are already pointing to a more than 4 percent rise.
He explained that usually, when the market rises from July 31 to October 31, "the incumbent person or party has been reelected."
But then he said: "I think that history is going to be tweaked a bit this time around."
Stovall compared this year's election to 1968, when President Lyndon B. Johnson stepped down and Vice President Hubert Humphrey entered the race as the Democratic candidate instead.
This happened against the backdrop of the Vietnam War, the assassinations of Martin Luther King, Jr. and Robert Kennedy and widespread protests across the country.
Stovall said: "We had the war in Vietnam as a very unpopular situation—this time around, we've got inflation and immigration.
"We had a Fed (the Federal Reserve) lowering interest rates back in '68, that did not help the incumbent and, anecdotally we also had conventions in Chicago.
"So we'll see right now whether the 5+ percent advance [in S&P gains since Harris entered the race] this time, which is equivalent to what we saw back in '68, proves that the incumbent will not get reelected."
Newsweek has contacted Stovall, via email, for further comment. It has also contacted teams for Trump and Harris, via email, for a response.

How Does The S&P Presidential Indicator Work?
If stocks, as measured by the S&P, move higher in the three full months before a presidential election, the incumbent party tends to stay in office.
But, if stock prices instead fall from August through October, the party that's been out of office typically wins.
Wall Street watchers have long cautioned that the indicator has failed in the past, usually during times of geopolitical unrest.
On top of the 1968 election, the three failures since 1945 also include 1956, when Dwight Eisenhower defeated Adlai Stevenson to win a second term—Egypt had nationalized the Suez Canal in the month before the election, which was then followed by a military attack by Israel, France and Great Britain. And 1980, when Ronald Reagan beat Jimmy Carter, the Iranian hostage crisis dominated the headlines.
In the 2020 election, is viewed by some as an outlier because the indicator did not signal a Joe Biden victory until the very end of the three-month period.
Stovall, chief investment strategist at CFRA Research, has previously said about the model that "it's a good guide, not gospel," and he said during his interview with CNBC Television this week, quoting former baseball catcher Yogi Berra who said: "It ain't over till it's over."


![[WATCH] Charlamagne Tha God Refutes Reports That Wendy Williams Is “Incapacitated”](https://thesource.com/wp-content/uploads/2025/01/Screenshot-2025-01-08-at-12.19.27-PM.png)


 English (US) ·